SmartStudy is the best online education website
SmartStudy is the best online education website
SYSTEMS DEVELOPMENT
Introduction
System analysis and design is a series of processes for analyzing and designing computer-based
information systems. Systems design allows a development team to roughly see what and how
their system will look like. An important result of systems analysis and design is an application
software, that is, software designed to support a specific organizational function or process.
Key Terms
- Critical path is the longest-duration path through the network.
- Activity is a task that must be performed.
- Event is a milestone marking the completion of one or more activities.
- Program Evaluation and Review Technique (PERT) is a network model that allows for
randomness in activity completion times.
- Structured walkthrough - It is a planned review of system by people not involved in its
development effort.
General Systems Theory
1. Systems Concepts
A system is a set of interacting components that work together to accomplish specific goals.
For example, a business is organized to accomplish a set of specific functions. Any situations,
which involve the handling or manipulation of materials or resources of any kind whether human,
financial or informative, may be structured and represented in the form of a system.
1.1 Characteristics of a System
i. Purpose � Systems exist to fulfill some objective or satisfy a need. A system may accomplish
more than one task. The purpose of a system is closely tied to its rationale.
ii. Rationale � This is the justification for a system�s existence.
iii. Efficiency � This is how well a system utilizes its resources, that is, doing things right using
the least amount of resources.
iv. Effectiveness � How well a system fulfills its purpose, assuming that its purpose is the right
one. Involves a system doing the right things.
v. Inputs� Entities that enter the system to produce output or furnish information.
vi. Outputs� Entities that exit from the system either as interfaces or for end-user activities.
They may be used to evaluate system�s efficiency and effectiveness.
vii. Transformation rules � They specify how the input is processed to produce output.
viii. Throughput � Measures the quantity of work a system accomplishes. Does not consider
the quality of the output.
ix. Boundary � Artificially delimits a system for study or discussion purposes. System
designers can only control those system components within the boundary.
x. Environment � That which impacts the system but is outside the system�s boundary. The
system cannot control events in the environment.
xi. Interfaces � Points where two systems meet and share inputs and outputs. Interfaces belong
to the environment although they may be inside the system boundary.
xii. Feedback� Recycles outputs as subsequent inputs, or measures outputs to assess
effectiveness.
Classification of Systems
Each system can be characterized along a wide range of characteristics.
Physical Systems Vs. Abstract Systems
A physical system consists of a set of elements, which are coordinated and operate as a whole
entity to achieve a certain objective. This system may also be called a concrete system.
An abstract system is an orderly arrangement of conceptual items or components.
Simple Systems vs. Complex Systems
A simple system has few components, and the relationship or interaction between elements is
uncomplicated and straightforward.
A complex system has many elements that are highly related and interconnected.
Open Systems vs. Closed Systems
An open system interacts with its environment. It is a system with a feedback mechanism
that promotes the free exchange of information between the system and the external entities.
Organizations are open systems.
A closed system has no interaction with the environment. This is a system that neither transmits
information to the outside world nor receives any information from the outside world. It is mainly a
scientific concept (e.g. physics experiments).
Open Loop Systems vs. Closed Loop Systems
An open-loop system is one which does not act in a controlled manner, that is, there is no
feedback loop, and so it has no measure of performance against standards.
A closed-loop system is one that functions in a controlled manner. Such a system accepts inputs,
works upon them according to some predefined processing rules and produces outputs. Such a
system is controlled via a feedback loop.
Stable/Static Systems vs. Dynamic Systems
A stable system undergoes very little change over time. A dynamic system undergoes rapid and
constant change over time.
Adaptive Systems vs. Non-Adaptive Systems
An adaptive system is able to change in response to changes in the environment. These systems
can also be described as cybernetic or self-organizing systems.
A non-adaptive system is not able to change in response to changes in the environment.
Deterministic Systems vs. Probabilistic Systems
Deterministic systems operate in a predictable manner. For example, thermostats and computer
programs. In probabilistic systems, however, it is not possible to determine the next state of
the system. These systems depend on probability distribution.
Permanent Systems vs. Temporary Systems
A permanent system exists for a relatively long period of time.
A temporary system exists for a relatively short period of time.
Components of Systems
Inputs
These provide the system with what it needs to operate. It may include machines, manpower,
raw materials, money or time.
Processes
Include policies, procedures, and operations that convert inputs into outputs.
Outputs
These are the results of processing and may include information in the right format, conveyed at
the right time and place, to the right person.
Systems Boundary
A system boundary defines the system and distinguishes it from its environment.
Subsystems
A subsystem is a unit within a system that shares some or all of the characteristics of that system.
Subsystems are smaller systems that make up a super-system / supra-system. All systems are
part of larger systems
Components of Systems
Environment System Boundary
Environment
Input Output
Environment Interacting subsystems
Inputs
These provide the system with what it needs to operate. It may include machines,
manpower, raw materials, money or time.
Environment
This is the world surrounding the system, which the system is a subsystem of.
Objectives and Application of Systems Approach
Fast Forward: There are multiple levels of explanation for any complex situation. All may
be true but their usefulness is different.
Objectives and Application of Systems Approach
Features of Systems Theory
1. All systems are composed of inter-related parts or sub-systems and the system can only be
explained as a whole. This is known as holism or synergy. The systems view is that the whole
is more than just some of its parts and those vital interrelationships will be ignored and
misunderstood if the separate parts are studied in isolation.
2. Systems are hierarchical, that is, the parts and sub-systems are made up of other smaller parts.
For example, a payroll system is a subsystem of the Accounting System,which is a sub of the
whole organization. One system is a sub of another.
3. The parts of a system constitute an indissoluble whole so that no part can be altered without
affecting other parts. Many organizational problems arise once this principle is flouted or
ignored. Changes to one department could create untold adverse effects on others - ripple
effects: e.g. changing a procedure in one department could affect others e.g. admissions -
faculty ,type of data captured, process. , etc.
4. The sub-systems should work towards the goals of their higher systems and should not pursue
their own objectives independently. When subsystems pursue their own objectives, a condition
of sub-optimality arises, and with this the falling of the organization is close at hand!
Information systems designers should seek to avoid the sub-optimality problem!
5. Organizational systems contain both hard and soft properties. Hard properties are those that can
be assessed in some objective way e.g. the amount of PAYE tax with tax code, size of product-
quantifiable
Soft properties - constitute individual taste. They cannot be assessed by any objective standard
or measuring process e.g. appearance of a product, suitability of a person for job and any
problem containing a political element.
Importance of Systems Theory:
a) It provides a theoretical framework for study of performance of businesses
b) It stresses the fact that all organizations are made up of subsystems, which must work together
harmoniously in order that goals of the overall system can be achieved.
c) It recognizes the fact that conflicts can arise within a system, and that such conflicts can lead to
sub-optimization and that, ultimately, can even mean that an organization does not achieve its
goals.
d) It allows the individual to recognize that he/she is a subsystem within a larger system, and that
the considerations of systems concept apply to him/her, also.
e) Given the above factors, it is clear that information-producing systems must be designed to
support the goals of the total system, and that this must be borne in mind throughout their
development.
Systems Theory Concepts
- Entropy � This is the tendency towards disorder (chaos) in a system. The more closed a
system is, the greater the entropy.
- Feedback � This is a control mechanism in open systems. Feedback involves measuring the
output of the system, comparing the output with a standard and using any difference to
modify subsequent input to ensure that the outputs conform to the required standards.
- Feed-forward � It means to take steps that make some adjustments to the system in advance
in order to face any expected deviations in future. Feedback monitors the past results whereas
feed-forward deals with future outcomes.
- Functional Decomposition � This involves factoring a system to its constituent subsystems.
The subsystems are also decomposed further into manageable sizes resulting in a hierarchy
structure of a system. Decomposition is used to analyse the existing system, to design and
finally implement a new system.
- Functional cohesion � Involves dividing into subsystems by grouping activities that logically
go together.
- Coupling � Occurs when two systems are highly interrelated.
- Decoupling � This is a process in which the subsystems are given autonomy and
independence. The subsystems operate independently thereby pursuing own objectives and
enhancing flexibility.
- Synergy � The whole is greater than the sum of its parts. At this point the focus is on global
system needs, not local issues. It means that more than one system working together produce
more and better results than each would achieve independently.
- Optimization � It is possible to achieve the best solution.
Elements of Control Include:
- Goal: This is the expected performance, plan or results.
- Sensor: Measures actual performance.
- Comparator: Compares expected results to actual results obtained.
- Effector: Reports deviation and initiates the response which may lead to a redirection of
activity, revision of the expectation or changing the plan.
- Feed-forward � It means to take steps that make some adjustments to the system in advance
in order to face any expected deviations in future. Feedback monitors the past results whereas
feed-forward deals with future outcomes.
- Functional Decomposition � This involves factoring a system to its constituent subsystems.
The subsystems are also decomposed further into manageable sizes resulting in a hierarchy
structure of a system. Decomposition is used to analyse the existing system, to design and
finally implement a new system.
- Functional cohesion � Involves dividing into subsystems by grouping activities that logically
go together.
- Coupling � Occurs when two systems are highly interrelated.
- Decoupling � This is a process in which the subsystems are given autonomy and
independence. The subsystems operate independently thereby pursuing own objectives and
enhancing flexibility.
- Synergy � The whole is greater than the sum of its parts. At this point the focus is on global
system needs, not local issues. It means that more than one system working together produce
more and better results than each would achieve independently.
- Optimization � It is possible to achieve the best solution.
- Sub-optimization � It is an occurrence that occurs when the objectives of one element or
subsystem conflicts with the objectives of the whole system.
- Sub-optimization � It is an occurrence that occurs when the objectives of one element or
subsystem conflicts with the objectives of the whole system.
- Equifinality � Certain results may be achieved with different initial conditions and in
different ways. In open systems, the same final state can be reached from several starting
points, one result can have different causes, or through different methods, there is more than
one way to achieve the objective.
- Goal-seeking � systems attempt to stabilize at a certain point.
- Holism � the analysis of a system is considered from the point of view of the whole system
and not on individual subsystems. Subsystems are studied in the context of the entire system.
1. Object-Oriented Programming (OOP)
This is a revolutionary concept that changed the rules in computer program development OOP
is organized around �objects� rather than �actions,� data rather than logic. Historically, a program
has been viewed as a logical procedure that takes input data, processes it, and produces output data.
The programming challenge was seen as how to write the logic, not how to define the data. OOP
takes the view that what we really care about are the objects we want to manipulate rather than the
logic required to manipulate them. Examples of objects range from human beings (described by
name, address, and so forth) to buildings and floors (whose properties can be described and
managed) down to the little widgets on your computer desktop (such as buttons and scroll bars).
The first step in OOP is to identify all the objects you want to manipulate and how they relate to
each other, an exercise often known as data modeling. Once you�ve identified an object, you
generalize it as a class of objects and define the kind of data it contains and any logic sequences
that can manipulate it. Each distinct logic sequence is known as a method. A real instance of
a class is called an �object� or, in some environments, an �instance of a class.� The object or
class instance is what you run in the computer. Its methods provide computer instructions and
the class object characteristics provide relevant data. You communicate with objects - and they
communicate with each other - with well-defined interfaces called messages. C++ and Java are the
most popular object-oriented languages today. The Java programming language is designed
especially for use in distributed applications on corporate networks and
the Internet.
Companies often commit significant resources to development, acquisition and continued
maintenance of application systems. These systems often control an organization�s assets and
may in themselves be considered an asset that needs to be protected and controlled.
One or more of the following situations will initiate an individual application or project:
i. A new opportunity that relates to a new or existing business process.
ii. A problem that relates to an actual business process.
iii. A new opportunity that will enable the organization to take advantage of technology.
iv. A problem with the current technology.
v. Organizational growth
vi. Merger or acquisition
vii. Revisions in government regulations
System development projects should be initiated using well-defined procedures to communicate
business needs to management. These procedures often require detailed documentation
identifying the need or problem, specifying the desired solution and relating the potential benefits to
the organization.
Aids in System Analysis and Design Include:
Methodologies � Comprehensive, multi-step approaches to systems development that
guide the work and influence the quality of the final product.
Techniques � Particular processes that an analyst will follow to ensure that the work is
well thought-out, complete and comprehensible to others on the project team.
2. Project Management
A project can be defined as a temporary sequence of unique, complex and connected activities
having one goal or purpose and that must be completed by specific time, within budget and
according to specification. It is a planned undertaking that has a beginning and an end and that
produces a predetermined result or product. Every project is constrained by its scope, time goals
and cost goals.
Projects have the following characteristics:
a) Unique purpose � a project is undertaken to fulfill a specific objective
b) Temporary � projects exist for a limited duration of time; often not perpetual
c) Require resources � such as money, manpower and machine resources
d) Should have a primary sponsor � usually an organisation, a department or individual
e) Involves uncertainty � a great deal of the project implementation is unknown the need for
planning and management.
The key competencies that project managers must develop are known as knowledge areas and
include:
- Scope management
- Time management
- Cost management
- Quality management
- Human resources management
- Communications management
- Risk management
- Procurement management and
- Integration management
The project stakeholders are the people involved in or are affected by project activities (including
project sponsor, project team, support staff, customers, users, suppliers and even opponents to
the project)
Tools � Computer programs that make it easy to use and benefit from the techniques
and to faithfully follow the guidelines of the overall development methodology.
To create new systems or to modify existing ones, information systems professionals follow
several steps:
a) Investigation � the process of understanding a problem or opportunity.
study the organization�s present systems and suggest actions to be taken after doing preliminary
investigation
b) Analysis � the process of defining what the system should accomplish.
c) Design � the process of determining how the system will accomplish its purpose.
d) Implementation � involves creating the system and putting it into use.
e) Maintenance � involves monitoring and changing an information system throughout its life.
System analysts use the system analysis and design process to develop new systems. They
study the organization�s present systems and suggest actions to be taken after doing preliminary
investigation
A project life cycle is a collection of project phases, which includes:
1. Concept
2. Development
3. Implementation
4. Close-out
The first two phases relate to project feasibility while the last two phases focus on delivering the
work and are often called project acquisition.
It is important not to confuse project life cycle with product life cycle. The project life cycle applies
to all projects regardless of the products being produced. On the other hand product life cycle
models vary considerably based on the nature of the product. For information systems a systems
development life cycle (SDLC) is used. SDLC is a framework for describing the phases involved in
developing and maintaining information systems.
Measures of Project Success
A project is successful when:
- The resulting information system is acceptable to the customer.
- May need to specifically mention the importance of functionality of the delivered system
- The system is delivered on time
- The system is delivered within budget
The system development process has a minimal impact on ongoing business operations.
Causes of Project Failures
� Failure to establish top-management commitment to the project
� Lack of organization�s commitment to the system development methodology
� Taking shortcuts through or around the system development methodology
� Poor expectations management
� Premature commitment to a fixed budget and schedule
� Poor estimating techniques
� Over-optimism
� Inadequate people management skills
� Failure to adapt to business changes
� Insufficient resources
� Failure to manage the plan
Systems Planning
Involves:
(i) Project identification and selection i.e. high level planning
(ii) Project initiation and planning i.e. low level planning
Project Identification and Selection
(i) Identify potential development projects
Sources of projects include:
� Management and business units
� Managers who want to make a system more efficient or less costly
� Formal planning groups
Projects are identified by:
� Steering committees
� Top management
� User departments
� Development group or senior information systems staff
Top-down identification focuses on global needs of the organization and is usually done
by top management or steering committees. Bottom-up identification is usually done
by business unit or information system group and doesn�t reflect overall goals of the
organization.
(ii) Classify and rank projects
This process is performed by top management, steering committee, business units or
information systems development group. Value chain analysis is often used. This is a
method to analyze an organization�s activities to determine where value is added and
costs are incurred.
(iii) Select projects
This is the process of considering short and long-term projects. Projects most likely to
achieve business objectives are selected. Decision requires consideration of:
� Perceived and real needs
� Potential and ongoing projects
� Current organizational environment
� Existing and available resources
� Evaluation criteria
� Outcomes
Project Initiation and Planning
Project planning and initiation involves:
� Team organization
� Establishing management procedures
� Identifying scope � Scope defines the boundaries of a project � what part of the business is to be
studied, analyzed, designed, constructed, implemented and ultimately improved?
� Identifying alternatives
� Feasibility/risk analysis and strategic assessment Feasibility is the measure of how beneficial or
practical the development of an information system will be to an organization. Feasibility analysis is
the process by which feasibility is measured.
Risk analysis helps understand and manage uncertainty. There is need to assess
probability, assess impact and establish contingency plan.
Estimation � Estimation of resources, such as human effort, time and cost. Estimation is extremely
difficult and (usually) inaccurate.
Cost/benefit analysis
Development costs are one-time costs that will not recur after the project has
been completed e.g. systems development, hardware/software, user training,
site preparation and data conversion.
Operating costs are costs that tend to recur throughout the lifetime of the
system. e.g. expenses on maintenance, data storage, communication sand
software licenses. Such costs can be classified as:
- Fixed costs � occur at regular intervals but at relatively fixed rates
- Variable costs � occur in proportion to some usage factor
Benefits
Tangible benefits are those that can easily be quantified e.g. cost reduction,
error reduction and increased sales
Intangible benefits are those benefits that are difficult or impossible to quantify
e.g. improved planning and control, improved employee morale and improved
decision making
Constraints
- Schedule e.g. project must be completed before a certain set date
- Costs e.g. the system cannot cost more than 1m
- Technology e.g. the system must be online, use MS Access database and run
- on a Windows platform
- Policy e.g. the system must use double-entry accounting
Scheduling � Usually use of Gantt charts and PERT/CPM methods (Performance
Evaluation and Review Technique/ Critical Path Method). The tools are not mutually
exclusive (especially when PERT is based on �activity on node� conventions). That is
why most project management software tools maintain both views simultaneously.
PERT (Program Evaluation and Review Technique) and CPM (Critical Path Method)
A PERT chart is a graphical network model that depicts a project�s tasks and the relationships
between those tasks. It was developed in the late 1950�s to plan and control large weapons
development projects for the US Navy. It is a project management tool used to schedule,
organise, and coordinate tasks within a project. PERT depicts task, duration, and dependency
information.
Critical Path Method (CPM), which was developed for project management in the private sector
at about the same time, has become synonymous with PERT, so that the technique is known by
any variation on the names: PERT, CPM, or CPM/PERT.
CPM
CPM provides the following benefits:
� Provides a graphical view of the project.
� Predicts the time required to complete the project.
� Shows which activities are critical to maintaining the schedule and which are not.
CPM models the activities and events of a project as a network. Activities are depicted as nodes
on the network and events that signify beginning or ending of activities are depicted as arcs
or lines between the nodes
Steps in CPM Project Planning
1. Specify the individual activities.
2. Determine the sequence of those activities.
3. Draw a network diagram.
4. Estimate the completion time for each activity.
5. Identify the critical path (longest path through the network)
6. Update the CPM diagram as the project progresses.
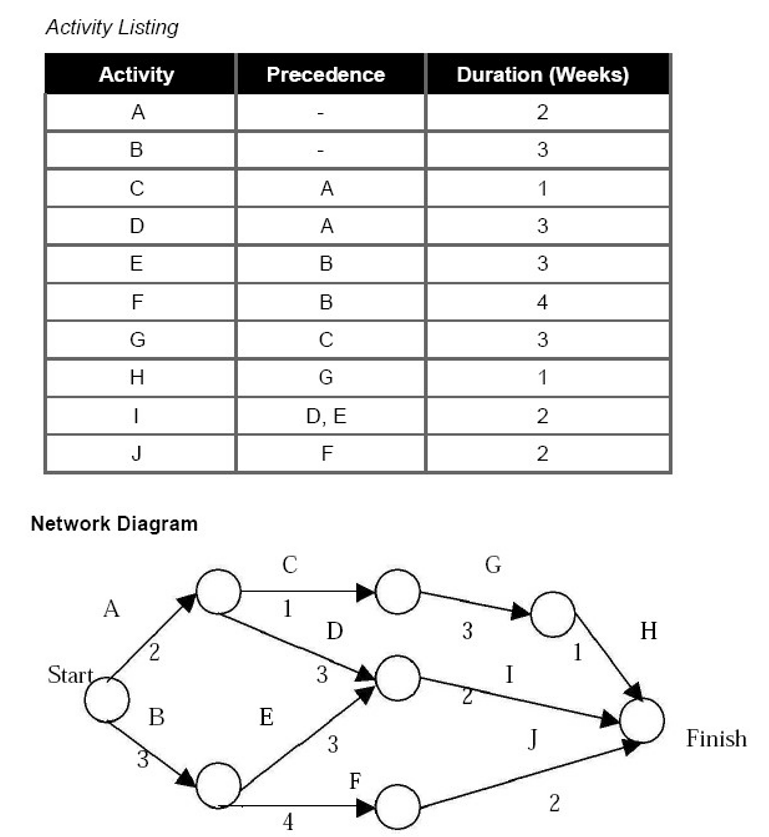
1. Specify the Individual Activities
From a work breakdown structure, a listing can be made of all the activities in the project.
This listing can be used as the basis for adding sequence and duration information in later
steps.
2. Determine the Sequence of the Activities
Some activities are dependent on the completion of others. A listing of the immediate predecessors
of each activity is useful for constructing the CPM network diagram.
3. Draw the Network Diagram
Once the activities and their sequencing have been defined, the CPM diagram can be drawn.
CPM was originally developed as an activity on node (AON) network, but some project planners
prefer to specify the activities on the arcs.
4. Estimate Activity Completion Time
The time required to complete each activity can be estimated using past experience or the
estimates of knowledgeable persons. CPM is a deterministic model that does not take into account
variation in the completion time; so only one number is used for an activity�s time estimate.
5. Identify the Critical Path
The critical path is the longest-duration path through the network. The significance of the critical
path is that the activities that lie on it cannot be delayed without delaying the project. Because of
its impact on the entire project, critical path analysis is an important aspect of project planning.
The critical path can be identified by determining the following four parameters for each activity:
� EST - earliest start time: the earliest time at which the activity can start given that its
precedent activities must be completed first.
� EFT - earliest finish time, equal to the earliest start time for the activity plus the time required
to complete the activity.
� LFT - latest finish time: the latest time at which the activity can be completed without
delaying the project.
� LST - latest start time, equal to the latest finish time minus the time required to complete the
activity.
Slack is the amount of time that an activity can be delayed past its earliest start or earliest finish
without delaying the project. The slack time for an activity is the time between its earliest and
latest start time, or between its earliest and latest finish time.
The critical path is the path through the project network in which none of the activities have slack,
that is, the path for which EST=LST and EFT=LFT for all activities in the path. A delay in the
critical path delays the project. Similarly, to accelerate the project it is necessary to reduce the total
time required for the activities in the critical path.
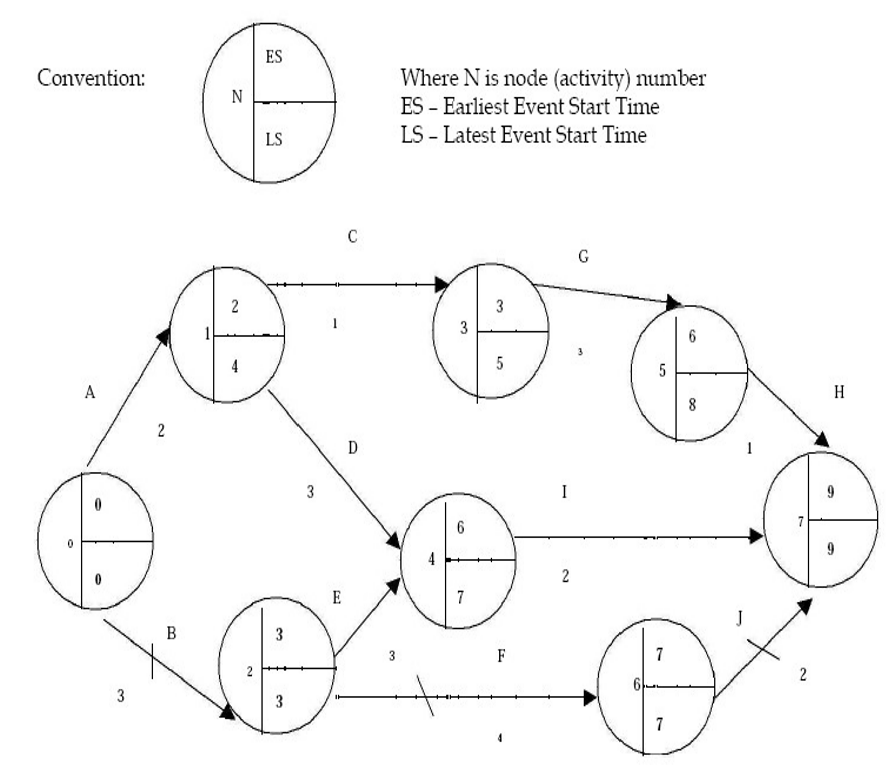
Critical Path: BFJ
6. Update CPM Diagram
As the project progresses, the actual task completion times will be known and the network
diagram can be updated to include this information. A new critical path may emerge, and
structural changes may be made in the network if project requirements change.
CPM Limitations
a) CPM was developed for complex but fairly routine project with minimal
uncertainty in the project completion times. For less routine projects, there is more
uncertainty in the completion times, and this uncertainty limits the usefulness of
the deterministic CPM model. An alternative to CPM is the PERT project-planning
model, which allows a range of durations to be specified for each activity.
Complex projects require a series of activities, some of which must be performed
sequentially and others that can be performed in parallel with other activities. This
collection of series and parallel tasks can be modeled as a network.
In 1957, the Critical Path Method (CPM) was developed as a network model for
project management. CPM is a deterministic method that uses a fixed time estimate
for each activity.
b) While CPM is easy to understand and use, it does not consider the time variations
that can have a great impact on the completion time of a complex project.
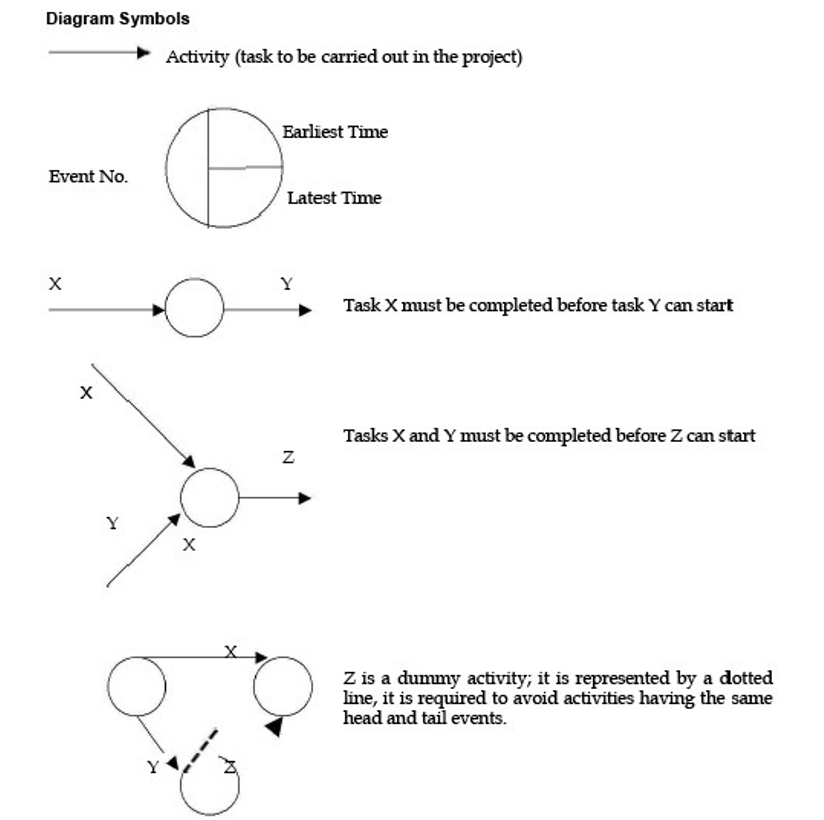
The Network Diagram
In a project, an activity is a task that must be performed and an event is a milestone marking the
completion of one or more activities. Before an activity can begin, all of its predecessor activities
must be completed. Project network models represent activities and milestones by arcs and
nodes. PERT originally was an activity on arc network, in which the activities were represented
on the lines and milestones on the nodes. Over time, some people began to use PERT as an
activity on node network. For this discussion, we will use the original form of activity on arc.
The PERT chart may have multiple pages with many sub-tasks.
The milestones generally are numbered so that the ending node of an activity has a higher number
than the beginning node. Incrementing the numbers by 10 allows for new ones to be inserted
without modifying the numbering of the entire diagram. The activities in the above diagram are
labeled with letters along with the expected time required to complete the activity.
Steps in the PERT Planning Process
PERT planning involves the following steps:
1. Identify the specific activities and milestones.
2. Determine the proper sequence of the activities.
3. Construct a network diagram.
4. Estimate the time required for each activity.
5. Determine the critical path.
6. Update the PERT chart as the project progresses.
1. Identify Activities and Milestones
The activities are the tasks required to complete the project. The milestones are the events
marking the beginning and ending of one or more activities. It is helpful to list the tasks in a table
that, in later, steps can be expanded to include information on sequence and duration.
2. Determine Activity Sequence
This step may be combined with the activity identification step since the activity sequence is
evident for some tasks. Other tasks may require more analysis to determine the exact order in
which they must be performed.
3. Construct the Network Diagram
Using the activity sequence information, a network diagram can be drawn showing the sequence
of the serial and parallel activities. For the original activity-on-arc model, the activities are depicted
by arrowed lines and milestones are depicted by circles or �bubbles�.
If done manually, several drafts may be required to correctly portray the relationships among
activities. Software packages simplify this step by automatically converting tabular activity
information into a network diagram.
4. Estimate Activity Times
Weeks are a commonly used unit of time for activity completion, but any consistent unit of time
can be used.
A distinguishing feature of PERT is its ability to deal with uncertainty in activity completion times.
For each activity, the model usually includes three time estimates:
� Optimistic time - generally the shortest time in which the activity can be completed. It is
common practice to specify optimistic times to be three standard deviations from the mean so
that there is approximately a 1% chance that the activity will be completed within the
optimistic time.
� Most likely time - the completion time having the highest probability. Note that this time is
different from the expected time.
� Pessimistic time - the longest time that an activity might require. Three standard deviations
from the mean are commonly used for the pessimistic time.
PERT assumes a beta probability distribution for the time estimates. For a beta distribution, the
expected time for each activity can be approximated using the following weighted average:
Expected time = (Optimistic + 4 x Most likely + Pessimistic) / 6
This expected time may be displayed on the network diagram.
To calculate the variance for each activity completion time, if three standard deviation times were
selected for the optimistic and pessimistic times, then there are six standard deviations between
them, so the variance is given by:
[(Pessimistic - Optimistic) / 6] 2
5. Determine the Critical Path
The critical path is determined by adding the times for the activities in each sequence and
determining the longest path in the project. The critical path determines the total calendar time
required for the project.
If activities outside the critical path speed up or slow down (within limits), the total project time
does not change. The amount of time that a non-critical path activity can be delayed without
delaying the project is referred to as slack time.
If the critical path is not immediately obvious, it may be helpful to determine the following four
quantities for each activity:
� EST - Earliest Start time
� EFT - Earliest Finish time
� LST - Latest Start time
� LFT - Latest Finish time
These times are calculated using the expected time for the relevant activities. The earliest start
and finish times of each activity are determined by working forward through the network and
determining the earliest time at which an activity can start and finish considering its predecessor
activities. The latest start and finish times are the latest times that an activity can start and finish
without delaying the project. LS and LF are found by working backward through the network.
The difference in the latest and earliest finish of each activity is that activity�s slack. The critical
path is the path through the network in which none of the activities have slack.
The variance in the project completion time can be calculated by summing up the variances in
the completion times of the activities in the critical path. Given this variance, one can calculate
the probability that the project will be completed by a certain date assuming a normal probability
distribution for the critical path. The normal distribution assumption holds if the number of activities
in the path is large enough for the central limit theorem to be applied.
Since the critical path determines the completion date of the project, the project can be accelerated
by adding the resources required to decrease the time for the activities in the critical path. Such a
shortening of the project sometimes is referred to as project crashing.
6. Update as Project Progresses
Make adjustments in the PERT chart as the project progresses. As the project unfolds, the
estimated times can be replaced with actual times. In cases where there are delays, additional
resources may be needed to stay on schedule and the PERT chart may be modified to reflect
the new situation.
Benefits of PERT
PERT is useful because it provides the following information:
� Expected project completion time.
� Probability of completion before a specified date.
� The critical path activities that directly impact on the completion time.
� The activities that have slack time and that can lend resources to critical pathactivities.
� Activity start and end dates.
Limitations
The following are some of PERT�s weaknesses:
� The activity time estimates are somewhat subjective and depend on individual group
judgment. In cases where there is little experience in performing an activity, the numbers may
be only a guess. In other cases, if the person or group performing the activity estimates the
time, there may be bias in the estimate.
� Even if the activity times are well estimated, PERT assumes a beta distribution for these time
estimates, but the actual distribution may be different.
� Even if the beta distribution assumption holds, PERT assumes that the probability distribution
of the project completion time is the same as that of the critical path. Because other paths can
become the critical path if their associated activities are delayed, PERT consistently
underestimates the expected project completion time
The underestimation of the project completion time due to alternate paths becoming
critical is perhaps the most serious of these issues. To overcome this limitation, Monte
Carlo simulations can be performed on the network to eliminate this optimistic bias in
the expected project completion time.