SmartStudy is the best online education website
SmartStudy is the best online education website
DEMAND ANALYSIS
Introduction
In any economy there are millions of individuals and institutions and to reduce things to a manageable proportion they are consolidated into three important groups; namely
-Households
-Firms
-Central Authorities
These are the dramatis personae of the economic theory and the stage on which much of their play is acted is called the MARKET (see lesson three for definition of market).
Household
This refers to all the people who live under one roof and who make or are subject to others making for them, joint financial decisions. The household decisions are assumed to be consistent, aimed at maximizing utility and they are the principal owners of the factors of production. In return for the factors or services of production supplied, they get or receive their income e.g.
- Labour � wages and salaries
-Capital � interest
-Land � rent
-Enterprise � profit
The firm
The unit that uses factors of production to produce commodities then it sells either to other firms, to household, or to central authorities. The firm is thus the unit that makes the decisions regarding the employment of the factors of production and the output of commodities. They are assumed to be aiming at maximizing profits.
Central authorities
This comprehensive term includes all public agencies, government bodies and other organisations belonging to or under the direct control of the government. They exist at the centre of legal and political power and exert some control over individual decisions taken and over markets.
DEFINITION
Demand is the quantity per unit of time, which consumers (households) are willing and able to buy in the market at alternative prices, other things held constant.
INDIVIDUAL VERSUS MARKET DEMAND
(i) Individual and market demand schedule
The plan of the possible quantities that will be demanded at different prices by an individual is called Individual demand schedule. Such a demand schedule is purely hypothetical, but it serves to illustrate the First Law of Demand and Supply that more of a commodity will be bought at a lower than a higher price.
|
PRICE (SH) |
QUANTITY DEMANDED PER WEEK |
|
20 |
3 |
|
18 |
3.5 |
|
16 |
4 |
|
14 |
5 |
|
13 |
6 |
|
12 |
7 |
|
11 |
8 |
|
10 |
9 |
Theoretically, the demand schedule of all consumers of a given commodity can be combined to form a composite demand schedule, representing the total demand for that commodity at various prices. This is called the Market demand schedule.
|
PRICE(SH) |
QUANTITY DEMANDED PER WEEK |
|
20 |
100000
|
|
18 |
120000
|
|
16 |
135000
|
|
14 |
150000
|
|
13 |
165000
|
|
12 |
180000
|
|
11 |
200000
|
|
10 |
240000
|
|
9 |
300000
|
|
8 |
350000
|
Table: The market demand schedule.
These prices are called Demand Prices. Thus, the demand price for 200,000 units per week is KShs 11 per unit.
(ii) The individual and market demand curves
The quantities and prices in the demand schedule can be plotted on a graph. Such a graph after the individual demand schedule is called The Individual Demand Curve and is downward sloping.
An individual demand curve is the graph relating prices to quantities demanded at those prices by an individual consumer of a given commodity
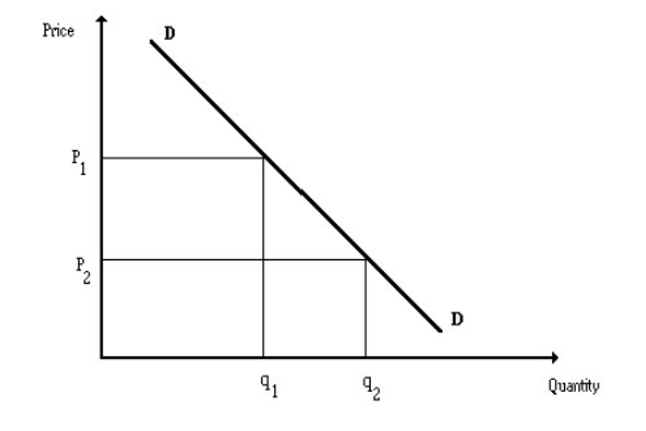
The curve can also be drawn for the entire market demand and is called a Market Demand
Curve:
A market demand curve is the horizontal summation of the individual demand curves i.e. by taking the sum of the quantities consumed by individual consumers at each price.
Consider a market consisting of two consumers:
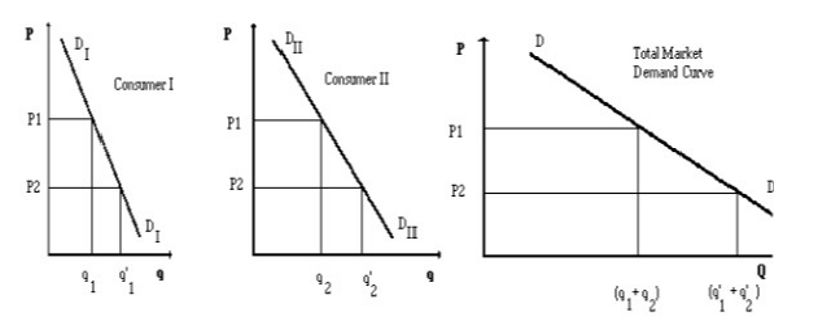
At price P1 in the figure above, consumer 1 demands q1, consumer II demands quantity q2, and total market demand at that price is (q1+q2). At price p2, consumer 1 demands q'1, and consumer II demands quantity q'2 and total market demand at that price is (q'1+q'2). DD is the total market demand curve.
FACTORS INFLUENCING DEMAND
These are broadly divided into factors determining household demand and factors affecting market demand.
Factors affecting household demand
Factors affecting the total market demand
These are broadly divided into the determinants of demand and conditions of demand.
(a) Own price of the product
This is the most important determinant of demand. The determinants of demand other than price are referred to as the conditions of demand.
Changes in the price of a product bring about changes in quantity demanded, such that when the price falls more is demanded. This can be illustrated mathematically as follows:
Qd = a - bp
Where Qd is quantity demanded
a is the factor by which price changes
p is the price Thus, ceteris paribus, there is an inverse relationship between price and quantity demanded. Thus the normal demand curve slopes downwards from left to right as follows:

(Prices of other related commodities.
Related commodities can be compliments or substitutes.
(i) Compliments: The compliments of a commodity are those used or consumed with it. Suppose commodities A and B are compliments, and the price of A increased.
This will lead to a fall in the quantity demanded of A, and will in turn lead to a fall in the demand for B. Example are bread and butter or cars and petrol.
(ii) Substitutes: The substitutes of a commodity are those that can be used or consumed in the place of the commodity. Suppose commodities X and Y are substitutes. If the price of X increases, the quantity demanded of X falls, and the demand for Y increases.
(c) The Aggregate National Income and its distribution among the population. In normal circumstances as income goes up the quantity demanded goes up. In such a case the good is called a normal good. However, there are certain goods whose demand shall increase with income up to a certain point, then remain constant. In such a case the good is called a necessity e.g. salt. Also there are some goods whose demand shall increase with income up to a certain point then fall as the income continues to increase. In such a case the good is called an inferior good.
(d) Taste and preference
There is a direct relationship between quantity demanded and taste. For instance, if consumers' taste and preferences change in favour of a commodity, demand will increase.
On the other hand, if taste and preferences change against the commodity e.g. due to changes in fashion, demand will fall. Taste and preferences are influenced by religion, community background, academic background, environment, etc.
Theories of Demand and Supply and Consumer Behaviour
(e) Expectation of future price changes
If it is believed that the price of a commodity is likely to be higher in the future than at present, then even though the price has already risen, more of the commodity may be bought at the higher price.
(g) Climatic/seasonal factors
Seasonal variations affect the demand of certain commodities such as cold drinks like sodas and heavy clothing.
(h) The size and structure of population
Changes in population overtime affect the demand for a commodity. Also as population increases, the population structure changes in such away that an increasing proportion of the population consists of young age group. This will lead to a relatively higher demand for those goods and services consumed mostly by young age group e.g. fashions, films, nightclubs, schools, toys, etc.
(i) Government influences e.g. a legislation requiring the wearing of seatbelts. (j) Advertising especially the persuasive ones
EXCEPTIONAL DEMAND CURVES
There are exceptions when more is demanded when the price increases. These happens in the case of:
(i) Inferior goods: Cheap necessary foodstuffs provide one of the best examples of exceptional demand. When the price of such a commodity increases, the consumers may give up the less essential compliments in an effort to continue consuming the same amount of the foodstuff, which will mean that he will spend more on it. He may find that there is some money left, and this he spends on more of the foodstuff and thus ends up consuming more of it than before the price rise. A highly inferior good is called Giffen good after Sir Robert Giffen.
(ii) Articles of ostentation (snob appeal or conspicuous consumption): There are some commodities that appear desirable only if they are expensive. In such cases the consumer buys the good or service to show off or impress others. When the price rises, it becomes more impressive to consume the product and he may increase his consumption. Some articles of jewellery, perfumes- and fashion goods fall in this category.
(iii) Speculative demand: If prices are rising rapidly, a rise in price may cause more of a commodity to be demanded for fear that prices may rise further. Alternatively, people may buy hoping to resell it at higher prices. In all these three cases, the demand curve will be positively sloped i.e. the higher the price, the greater the quantity bought. These demand curves are called reverse demand curves (also called perverse or abnormal demand curve).
TYPES OF DEMAND
There are four types of demand namely Competitive Demand, Joint or Complementary Demand, Composite Demand and Derived Demand. Demand is the amount of a product buyers are willing and able to purchase at a given price over a particular period of time.
a. Competitive Demand Commodities are substitutes if one can be used in place of the other. Substitute goods serve the same purpose and therefore compete for the consumers� income. They are said to have competitive demand because of the fact that they compete for the consumers� income. Examples of substitute goods are Milo and bournvita, butter and margarine and others. A change in the price of one affects the demand for the other. If for instance there is an increase in the price of butter, demand for margarine will increase which will ultimately increase the price of margarine, provided the supply of margarine does not change. On the other hand a decrease in the price of butter will lead to a decrease in the demand for margarine, and hence a fall in its price, given the supply.
b. Joint or Complementary Demand
Two or more goods are said to be jointly demanded when they must be consumed together to provided a given level of satisfaction. Some examples are cars and fuel, compact disc players and CD. There are perfect complementary goods and imperfect or poor complementary goods. For perfect complementary goods, the consumer practically cannot do without the other. An example is cars and fuel. On the other hand, for imperfect complementary goods, a consumer can do without the other, so long as a substitute is obtained. For complementary demand, a change in the price of one good affects the demand for the other. If there should be an increase in the price of compact disc players, there will be a decrease in the demand for discs, other things being equal.
c. Derived Demand
When the demand for a commodity is derived from the demand for the final commodity, that commodity is said to have derived demand. Wood may be demanded for the purpose of manufacturing furniture and not for its own sake. Here, the demand for wood is derived from the demand for furniture. Demand for wood is therefore a derived demand. Factors of production such as land, labor, and capital have derived demand. This is because an increase in the demand for a commodity will result in an increase in the factors of production used in producing the goods. The price of the factors of production will increase, other things being equal.
d. Composite Demand Composite demand applies to commodities which have several uses or are demanded for several and different purposes. Wood as mentioned in the example above is used for furniture � tables, chairs, beds, windows, doors and others. A change in demand for one of them will affect all others. If there is an increase in demand for table this will result in higher prices being paid for wood. The high price for wood will increase the cost of production of chairs, bed, windows and doors and any other thing for which wood is used in manufacturing.
MOVEMENT ALONG AND SHIFTS OF DEMAND CURVES
There are basically two; movements in demand curves, namely:
1. Movement along the demand curve. Movement along the demand curve are brought by changes in own price of the commodity.
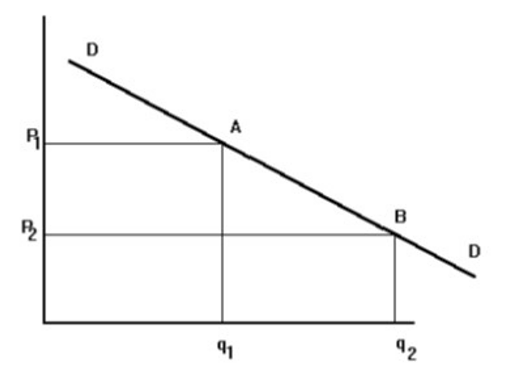
When price falls from p1 to p2, quantity demanded increases from q1 to q2 and movement along the demand curve is from A to B. Conversely when price rises from p2 to p1 quantity demanded falls from q2 to q1 and movement along the demand curve is from B to A.
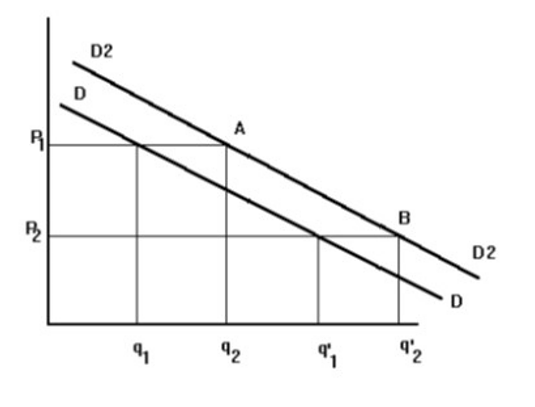
2. Shifts in demand curve
Shifts in the demand curve are brought about by the changes in factors like taste, prices of other related commodities, income etc other than the price of the commodity. The change in the demand for the commodity is indicated by a shift to the right or left of the original demand curve.
In the figure below, DD represents the initial demand before the changes. When the demand increases, the demand curve shifts to the right from position DD to positions D2D2. The quantity demanded at price P1 increases from q1 to q'1. Conversely, a fall in demand is indicated by a shift to the left of the demand curve from D2D2 to DD. The quantity demanded at price P1 decreases from q1 to q1
Elasticity of Demand
Definition of Elasticity
Is defined as the ratio of the relative change of one (dependent) variable to changes in another (independent) variable, or it�s a percentage change of one variable given a one percent change in another
b) Elasticity of Demand
Measures the extent to which the quantity demanded of a good responds to changes in one of the factors affecting demand
TYPES OF ELASTICITY
The various types of the elasticity of demand are: Price Elasticity, Income elasticity and Cross Elasticity.
Price Elasticity of Demand
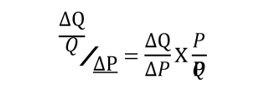
Is the responsiveness of the quantity demanded to changes in price; its co-efficient is Ped = Proportionate change in quantity demanded/ Proportionate change in price
Types of Price Elasticity of demand
a) Perfectly inelastic demand
Demand is said to be perfectly inelastic if changes in price have no the quantity demanded so that the demand is infinitely price elastic. This is the case of an absolute necessity i.e. one which a consumer cannot do without and must have in fixed amount e.g. analysis, insulin etc.
b) Inelastic demand
This is where changes in price bring about changes in quantity demanded in less proportion so that elasticity is less than one. This is the case of a necessity or a habit forming commodity e.g. drinks or cigarettes.
c) Unit Elasticity of demand
Is where changes in price bring about changes in quantity demanded in the same proportion and the elasticity of demand is equal to one or unity. This is for commodities, which are between a necessity and a luxury, e.g. film going.
d) Elastic demand
Demand is said to be price elastic if changes in price being about changes in quantity demanded in greater proportion so that elasticity is greater than one. This is the case of a luxury, i.e. one that can be done without or a commodity with close substitutes.
e) Perfectly Elastic demand
Demand is perfectly elastic when consumers are prepared to buy all they can obtain at some price and none at an even slightly higher price.
This is the case of perfectly competitive market i.e. where there are many producers producing the same product. Each of them is too insignificant to increase or reduce the market price.
Measurement of Elasticity, Point and Arc Elasticity
a) Point Elasticity:
This measures elasticity at a particular point and is only valid or based on small movements i.e.Ped
|
|
Price |
Quantity
|
|
Point A: |
Kshs 3.01 |
4.00 |
|
Point B: |
Kshs
3.00 |
4.10 |